Chapter one
spectrophotometric techniques.
In general, spectrophotometry is used to quantify the concentration of various analytes based on the amount of light that the analyte absorbs. It is based on the theory of Beer’s law, which states that the amount of absorbance of a solution is directly proportional to the solution’s concentration. In practical terms, the darker the solution, the higher the absorbance and the more concentrated the solution.
Beer’s: The amount of light absorbed by a solution is directly proportional to the concentration of the molecules in the solution
Lambert: The absorbance of a light by a solution increase with the thickness of the light path
Beers and Lambert Law: Under suitable condition, the amount of light absorbed by a colored solution, when illuminated with a light of suitable wavelength, is directly proportional to the concentration of the colored solution and the length of the light path through the solution
A cuvette containing the solution to be analyzed is placed within a basic spectrophotometer so that light can be shown through it as shown in figure 001. The solution will absorb some of the light (absorbance) and the remainder will be transmitted through the cuvette to the photodetector. Notice that the arrow to the right of the cuvette, which represents the transmitted light, is smaller than the arrow to the left of the cuvette, which represents the incident light. The ratio of the amount of transmitted light divided by the amount of incident light is known as transmittance. This is demonstrated mathematically as follows:
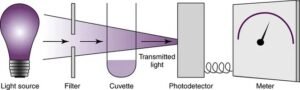
Figure 001: Light path through a spectrophotometer
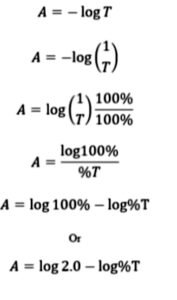
Transmittance ratios range from 0.000 to 1.000. By multiplying by 100, percent transmittance values can be obtained, ranging from 0.00 to 100.00 on a linear scale. If all of the light is transmitted through a solution—that is, no light is absorbed by the solution—the transmittance ratio is 1.00, and the percent transmittance is 100%. Conversely, if no light is transmitted through the solution (i.e., there is 100% absorbance of the light by the solution), the transmittance ratio is 0.000, or 0% transmittance. Mathematically, transmittance and absorbance are related by the following formula:
Example 001
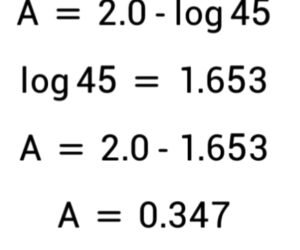
A manual creatinine assay was performed using the Jaffé method in a MLT student lab. A 45% T reading was obtained for the cuvette containing the level 1 creatinine control and reagent. What is the absorbance value?
Given a 60% T reading on a spectrophotometer, what is the absorbance value? Your turn!
Example 001b
Given a transmittance ratio of 0.400, what is the absorbance value? To solve this problem, first convert the transmittance ratio to a percent transmittance value
0.400 transmittance ×100=40.0% transmittance
Next, substitute 40.0% T into the conversion formula:
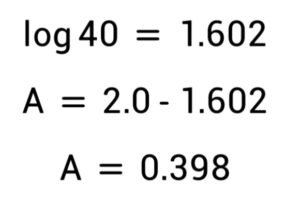
therefore, the transmittance ratio of 0.400 is equal to an absorbance value of 0.398.
Given a transmittance ratio of 0.125, what is the absorbance value? Your turn!
Just measuring the absorbance or % T values of solutions will not result in any meaningful results. When analytes are measured, “standards” are used within the analysis. Standards are known concentration of the chemical that is to be analyzed. By including standards within an analysis, the patient specimens can be compared with the standards for quantification. We know before we analyze the standards what the concentrations of the standards are and within the analysis we measure the absorbance of the standards.
Once the standards and patient specimens’ absorbance values are measured, there are three techniques to determine the concentration of the analyte in the patient’s specimen. These techniques can be used when performing a manual method and are also used by automated instruments to determine the concentration of analytes and controls.
- Single-Standard Method for Determining the Concentration of Unknowns
Beer’s law states that A=abc and as b and c are constants, in practice, A∝c If an assay is performed using a single standard and patient and quality control specimens, the absorbance’s of the patients and quality-control samples can be compared to the standard. A ratio and proportion calculation can determine the concentrations of our patients and quality control samples.
Example 002: A manual glucose assay is performed using a single 150 mg/dL standard. Upon analysis, the absorbance of the standard is 0.465. The absorbance of a patient’s sample is 0.338. What is the concentration of the patient’s sample?
Use this formula to get the concentration of the patient.
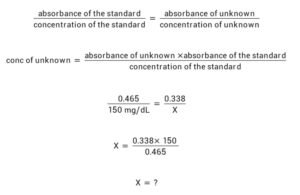
Ans = 109 mg/dL.
Example 003. A manual serum creatinine is performed in a MLT student laboratory experiment. A 5.0 mg/dL standard is used and the following results were obtained: Absorbance of the standard = 1.142, absorbance of the unknown = 0.778. What is the concentration of the unknown? Use the above formula.
Ans = 3.4 mg/dL
$$x^2 + 2x + 1 = 0$$